
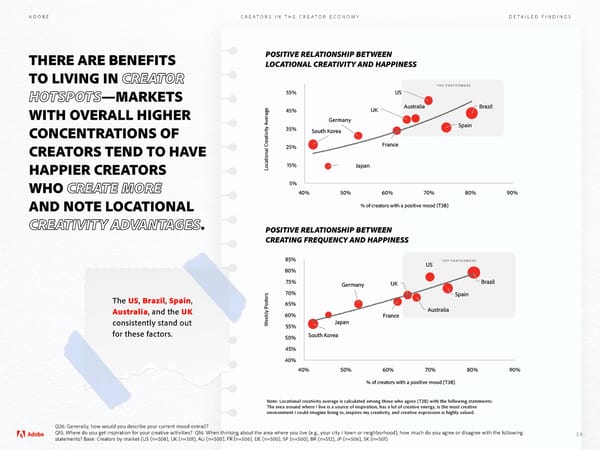
ADOBE CREATORS IN THE CREATOR ECONOMY DETAILED FINDINGS THERE ARE BENEFITS POSITIVE RELATIONSHIP BETWEEN LOCATIONAL CREATIVITY AND HAPPINESS TO LIVING IN CREATOR TOP PERFORMERS HOTSPOTS—MARKETS 55% US WITH OVERALL HIGHER 45% UK Australia Brazil Germany Spain CONCENTRATIONS OF 35% South Korea CREATORS TEND TO HAVE 25% France HAPPIER CREATORS Locational Creativity Average15% Japan WHO CREATE MORE 5% 40% 50% 60% 70% 80% 90% % of creators with a positive mood (T3B) AND NOTE LOCATIONAL CREATIVITY ADVANTAGES. POSITIVE RELATIONSHIP BETWEEN CREATING FREQUENCY AND HAPPINESS 85% US TOP PERFORMERS 80% 75% Germany UK Brazil 70% Spain The US, Brazil, Spain, 65% Australia, and the UK 60% Australia France consistently stand out Weekly Posters55% Japan for these factors. 50% South Korea 45% 40% 40% 50% 60% 70% 80% 90% % of creators with a positive mood (T3B) Note: Locational creativity average is calculated among those who agree (T2B) with the following statements: The area around where I live is a source of inspiration, has a lot of creative energy, is the most creative environment I could imagine living in, inspires my creativity, and creative expression is highly valued. Q26: Generally, how would you describe your current mood overall? Q15. Where do you get inspiration for your creative activities? Q16. When thinking about the area where you live (e.g., your city / town or neighborhood), how much do you agree or disagree with the following 20 statements? Base: Creators by market (US (n=508), UK (n=501), AU (n=500), FR (n=506), DE (n=500), SP (n=500), BR (n=512), JP (n=506), SK (n=501)
 Adobe - Future of Creativity Study Page 19 Page 21