
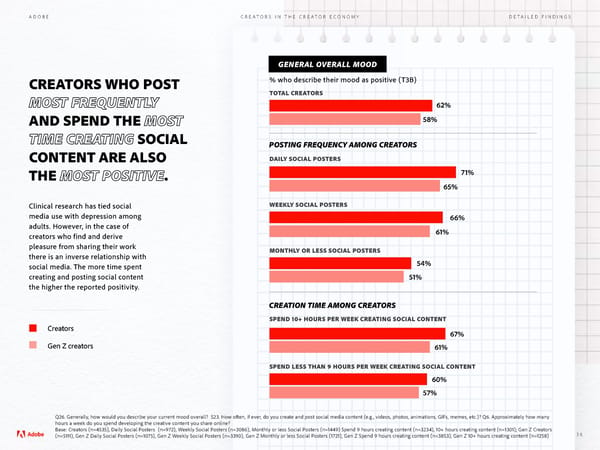
ADOBE CREATORS IN THE CREATOR ECONOMY DETAILED FINDINGS GENERAL OVERALL MOOD CREATORS WHO POST % who describe their mood as positive (T3B) MOST FREQUENTLY TOTAL CREATORS 62% AND SPEND THE MOST 58% TIME CREATING SOCIAL POSTING FREQUENCY AMONG CREATORS CONTENT ARE ALSO DAILY SOCIAL POSTERS THE MOST POSITIVE. 71% 65% Clinical research has tied social WEEKLY SOCIAL POSTERS media use with depression among 66% adults. However, in the case of 61% creators who find and derive pleasure from sharing their work MONTHLY OR LESS SOCIAL POSTERS there is an inverse relationship with 54% social media. The more time spent creating and posting social content 51% the higher the reported positivity. CREATION TIME AMONG CREATORS SPEND 10+ HOURS PER WEEK CREATING SOCIAL CONTENT Creators 67% Gen Z creators 61% SPEND LESS THAN 9 HOURS PER WEEK CREATING SOCIAL CONTENT 60% 57% Q26. Generally, how would you describe your current mood overall? S23. How often, if ever, do you create and post social media content (e.g., videos, photos, animations, GIFs, memes, etc.)? Q6. Approximately how many hours a week do you spend developing the creative content you share online? Base: Creators (n=4535), Daily Social Posters (n=972), Weekly Social Posters (n=3086), Monthly or less Social Posters (n=1449) Spend 9 hours creating content (n=3234), 10+ hours creating content (n=1301); Gen Z Creators (n=5111), Gen Z Daily Social Posters (n=1075), Gen Z Weekly Social Posters (n=3390), Gen Z Monthly or less Social Posters (1721), Gen Z Spend 9 hours creating content (n=3853), Gen Z 10+ hours creating content (n=1258) 36
 Adobe - Future of Creativity Study Page 35 Page 37